Improving the Q# Debugging Experience
This Fall, I interned with Microsoft’s quantum research team, working on the compiler for Q#, Microsoft’s quantum computing language. Specifically, my project was to introduce debugging capabilities to Q#.
This post is written as part of the 2021 Q# Advent Calendar of blog posts.
Debugging in Q#
Anyone learning software development quickly learns the importance of debugging, the act of examining a program’s execution to understand the causes of unexpected behavior. Every developer has written code like Print("Here"); Print("var_x is " + var_x); or even Print("WHY AM I IN THIS IF STATEMENT!?"); in an effort to debug their program. Thankfully, debugging tools such as LLDB provide more sophisticated methods of debugging.
Among other things, debuggers allow developers to place breakpoints at specific lines of code, pausing the execution of the program if it reaches that point. When the execution is paused, the debugger allows the developer to inspect the state of the program and the current values of its variables. In order for the debugger to provide this functionality, the compiled executable of a program must contain information that links its machine code back to the original source code. This way, when the debugger attaches to a program’s execution, it can pause the executable according to the placement of breakpoints in the source code, and it can associate the executing program’s data with variables in the source code.
In the context of Q#, if we want our users – Q# developers – to have the ability to debug their programs, the Q# compiler must create and emit the necessary debug information. This leads to the core topic of this blog post: a new Q# feature which improves the Q# debugging experience by emitting debug information when Q# source code is compiled.
The old Q# compiler
In the current Quantum Development Kit, the Q# compiler turns Q# code into C# code wrapping the Q#’s functionality. This C# wrapper is then compiled into an executable. Since C# supports debugging, the executable can be compiled with debug information linking the executable to the C# code, which is then loosely linked back to the Q# source code.
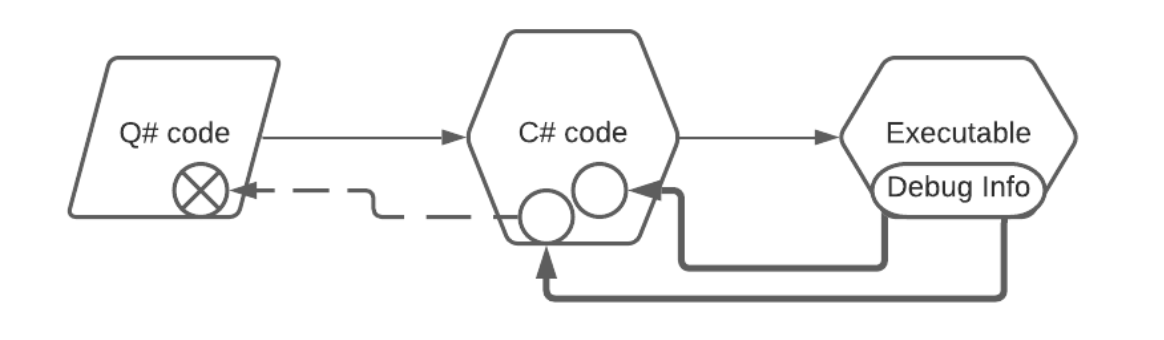
Since the executable’s debug information actually points to the C# code wrapping the functionality of the Q# code, the debug experience provided to the user is limited. You can try to set breakpoints in the Q# source code, but even with simple programs, the breakpoints are often associated with the machine code incorrectly. Also, the call stack in the debugger displays extraneous functions corresponding to wrappers in the C# code that are unrelated to the Q# source code. This means that unless the user happens to be knowledgeable about the Q# compilation process, debugging a Q# file can be a frustrating and confusing experience.
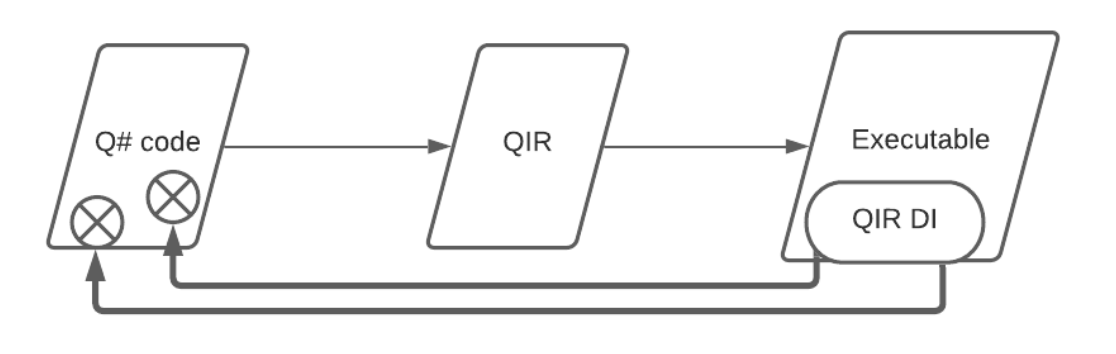
The new Q# compiler
For reasons beyond the scope of this blog post, the Q# compiler will be shifting away from the current C# wrapper setup and will instead be compiling Q# into Quantum Intermediate Representation (QIR). QIR is a specification of LLVM Intermediate Representation (IR), which is a widely used low-level language comparable to assembly code. The key idea behind intermediate representation is that any source language can be compiled to IR, and then IR can be compiled to any specific hardware configuration. This modularity minimizes the complexity of adding new languages and new hardware. One of the benefits of the new, QIR-based compiler setup is that we can use existing LLVM tools to emit debug information within the IR in a standardized format. Unlike in the old compiler setup, this debug information is directly related to the Q# source code. This avoids the issues of misplaced breakpoints and extraneous debug information that occur when debugging Q# that was compiled with the old C#-based compiler.
Flow of debug information
Let’s zoom out a bit and discuss the entire toolchain culminating in the ability to debug a Q# file. First, the Q# compiler uses the LLVMSharp API to emit QIR containing debug information. This debug information refers to locations in the Q# source file. The second step is to compile the QIR into an executable, passing along the debug information referring to the original source file. Finally, a debugger is attached which uses the debug information in the executable to manipulate the program’s execution and present the user information about the program’s state. Note that only the first step is specific to Q#. Because of our modular compilation strategy, the remaining steps can be implemented in any number of ways. For the purposes of developing this feature, we have been using existing LLVM tools.
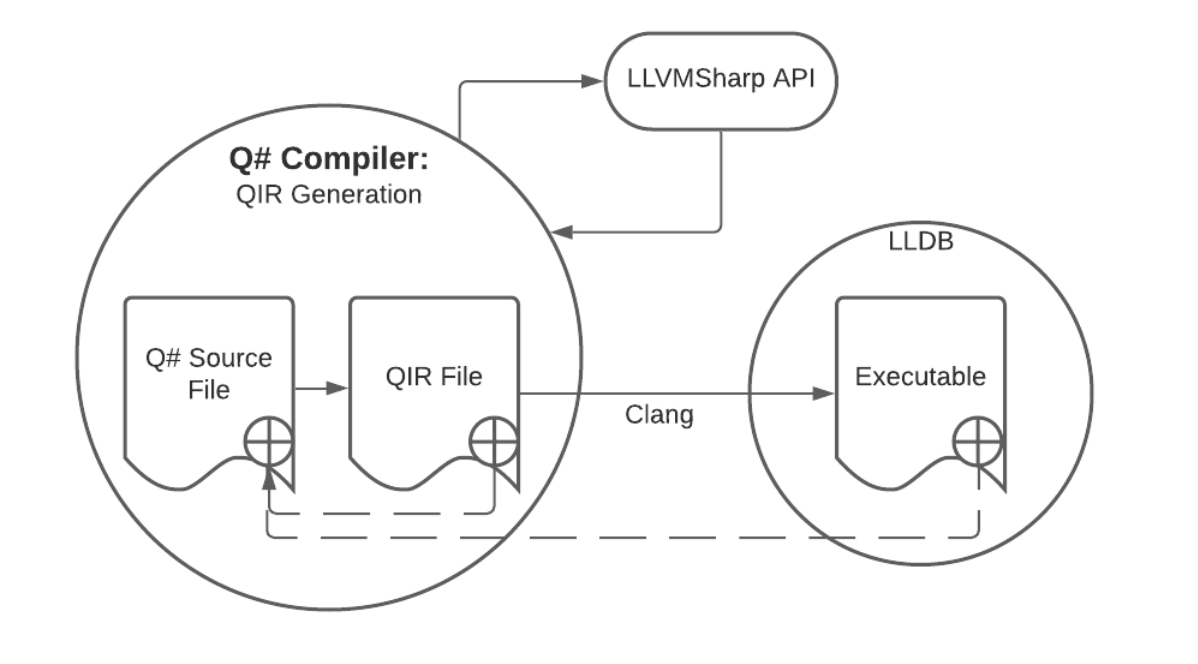
Step one: emit debug information in the QIR created from a Q# file
First, during compilation of the Q# file, debug information is extracted from the source file and included in the emitted QIR. This first step is the only one specific to Q# and is the heart of this feature. When compiling Q# into QIR, we use the cross-platform LLVMSharp API to generate an LLVM IR file (recall that QIR is IR). To include debug info, we use specific LLVMSharp tools that annotate the IR with debug information following the DWARF format. This standardized format is important so that existing LLVM tools can be used for the remainder of the debug process. To see what QIR looks like with and without debug information annotations, take a look at the example below.
Example Q# code
namespace Microsoft.Quantum.Qir.Development {

    open Microsoft.Quantum.Convert;
    open Microsoft.Quantum.Arrays;
    open Microsoft.Quantum.Canon;
    open Microsoft.Quantum.Diagnostics;
    open Microsoft.Quantum.Intrinsic;
    open Microsoft.Quantum.Math;

    @EntryPoint()
    operation RunExample() : Int {

        mutable myInt = 26;
        return myInt;

    }

}
Corresponding QIR without debug info
%Range = type { i64, i64, i64 }
%String = type opaque

@PauliI = internal constant i2 0
@PauliX = internal constant i2 1
@PauliY = internal constant i2 -1
@PauliZ = internal constant i2 -2
@EmptyRange = internal constant %Range { i64 0, i64 1, i64 -1 }

define internal i64 @Microsoft__Quantum__Qir__Development__RunExample__body() {
entry:
  %myInt = alloca i64, align 8
  store i64 26, i64* %myInt, align 4
  ret i64 26
}

define i64 @Microsoft__Quantum__Qir__Development__RunExample__Interop() #0 {
entry:
  %0 = call i64 @Microsoft__Quantum__Qir__Development__RunExample__body()
  ret i64 %0
}

define void @Microsoft__Quantum__Qir__Development__RunExample() #1 {
entry:
  %0 = call i64 @Microsoft__Quantum__Qir__Development__RunExample__body()
  %1 = call %String* @__quantum__rt__int_to_string(i64 %0)
  call void @__quantum__rt__message(%String* %1)
  call void @__quantum__rt__string_update_reference_count(%String* %1, i32 -1)
  ret void
}

declare void @__quantum__rt__message(%String*)

declare %String* @__quantum__rt__int_to_string(i64)

declare void @__quantum__rt__string_update_reference_count(%String*, i32)

attributes #0 = { "InteropFriendly" }
attributes #1 = { "EntryPoint" }
Corresponding QIR with debug info
%Range = type { i64, i64, i64 }
%String = type opaque

@PauliI = internal constant i2 0
@PauliX = internal constant i2 1
@PauliY = internal constant i2 -1
@PauliZ = internal constant i2 -2
@EmptyRange = internal constant %Range { i64 0, i64 1, i64 -1 }

define internal i64 @Microsoft__Quantum__Qir__Development__RunExample__body() !dbg !7 {
entry:
  %myInt = alloca i64, align 8, !dbg !14
  store i64 26, i64* %myInt, align 4, !dbg !14
  call void @llvm.dbg.declare(metadata i64* %myInt, metadata !13, metadata !DIExpression()), !dbg !14
  ret i64 26, !dbg !15
}

; Function Attrs: nounwind readnone speculatable willreturn
declare void @llvm.dbg.declare(metadata, metadata, metadata) #0

define i64 @Microsoft__Quantum__Qir__Development__RunExample__Interop() #1 {
entry:
  %0 = call i64 @Microsoft__Quantum__Qir__Development__RunExample__body()
  ret i64 %0
}

define void @Microsoft__Quantum__Qir__Development__RunExample() #2 {
entry:
  %0 = call i64 @Microsoft__Quantum__Qir__Development__RunExample__body()
  %1 = call %String* @__quantum__rt__int_to_string(i64 %0)
  call void @__quantum__rt__message(%String* %1)
  call void @__quantum__rt__string_update_reference_count(%String* %1, i32 -1)
  ret void
}

declare void @__quantum__rt__message(%String*)

declare %String* @__quantum__rt__int_to_string(i64)

declare void @__quantum__rt__string_update_reference_count(%String*, i32)

attributes #0 = { nounwind readnone speculatable willreturn }
attributes #1 = { "InteropFriendly" }
attributes #2 = { "EntryPoint" }

!llvm.ident = !{!0}
!llvm.module.flags = !{!1, !2, !3}
!llvm.dbg.cu = !{!4}

!0 = !{!"Microsoft.Quantum.QsCompiler with Microsoft.Quantum.QirGeneration V 1.0.0.0"}
!1 = !{i32 2, !"Dwarf Version", i32 4}
!2 = !{i32 2, !"Debug Info Version", i32 3}
!3 = !{i32 2, !"CodeView", i32 1}
!4 = distinct !DICompileUnit(language: DW_LANG_C99, file: !5, producer: "Microsoft.Quantum.QsCompiler with Microsoft.Quantum.QirGeneration V 1.0.0.0", isOptimized: false, runtimeVersion: 0, emissionKind: FullDebug, enums: !6, splitDebugInlining: false)
!5 = !DIFile(filename: "Program.qs", directory: "/home/ryan-moreno/source/qsharp-compiler/examples/QIR/Development")
!6 = !{}
!7 = distinct !DISubprogram(name: "RunExample", linkageName: "Microsoft__Quantum__Qir__Development__RunExample__body", scope: null, file: !5, line: 11, type: !8, scopeLine: 11, spFlags: DISPFlagLocalToUnit | DISPFlagDefinition, unit: !4, retainedNodes: !12)
!8 = !DISubroutineType(types: !9)
!9 = !{!10, !11}
!10 = !DIBasicType(name: "Int", size: 64, encoding: DW_ATE_signed)
!11 = !DIBasicType(name: "This debug type is not yet supported")
!12 = !{!13}
!13 = !DILocalVariable(name: "myInt", scope: !7, file: !5, line: 13, type: !10)
!14 = !DILocation(line: 13, column: 9, scope: !7)
!15 = !DILocation(line: 14, column: 9, scope: !7)
As specific examples of the debug information emitted, each time the compiler comes across a Q# statement, it emits a debug location, which is an annotation in the QIR linking the corresponding QIR instruction with the statment’s source file and line number. Additionally, whenever the compiler comes across a variable declaration, the QIR is annotated with the variable’s name, type, and scope (the chunk of code for which the variable is valid). The LLVMSharp API ensures that this annotation also includes the location of the variable’s assigned memory. The utility of this debug information will become clear in step three.
Step two: compile QIR with debug annotations to an executable
Once we have the QIR containing debug information, the next step is compiling the QIR into a hardware-specific executable. This step is separate from the Q# compiler and is not specific to any particular quantum language. The intention is that this step will be implemented differently for each quantum hardware target. It can also be implemented by compiling the QIR into an executable that simulates the quantum computations on a classical computer. For the purposes of testing and demoing the debug experience, we take this approach, using Clang, an existing LLVM tool, to compile the QIR into an executable that can be run on your laptop. (Yes, simulating quantum computations on classical computers ignores the advantages of quantum hardware. However, this is irrelevant to the debug experience.)
Step three: attach a debugger to the executable to debug the Q# file
Now that we have an executable which contains debug information in a DWARF format, we can use LLVM’s ubiquitous debugger, LLDB, in order to actually debug the Q# file. To enjoy a pleasant user interface when debugging, I recommend using VS Code’s built-in debugger with the CodeLLDB extension.
LLDB uses the debug information that was passed from the Q# compiler to the QIR to the executable in order to show the user information about the program’s state during execution. For example, recall the debug location information the Q# compiler emitted. LLDB can use this information to link each step of machine code to its corresponding line of source code. This way, LLDB knows to pause execution whenever it reaches a line of machine code corresponding to a line from source code that has a breakpoint set.
In the case of debug information for variables, because the Q# compiler kept track of the variable’s location in memory, LLDB can access the data for a given variable during program execution; because the compiler stored the variable’s type, LLDB knows how to interpret this data as the variable’s value; because the compiler stored the variable’s name in the source file, LLDB can display this information in a way that’s useful to the user. Finally, because the compiler stored the scope of each variable, the debugger knows which variables should be visible to the user at any given point in the program’s execution.
Current state of Q# debugging
Currently, the debug information emitted within the QIR provides the following capabilities when debugging a Q# file:
- The user can place a breakpoint at any Q# statement.
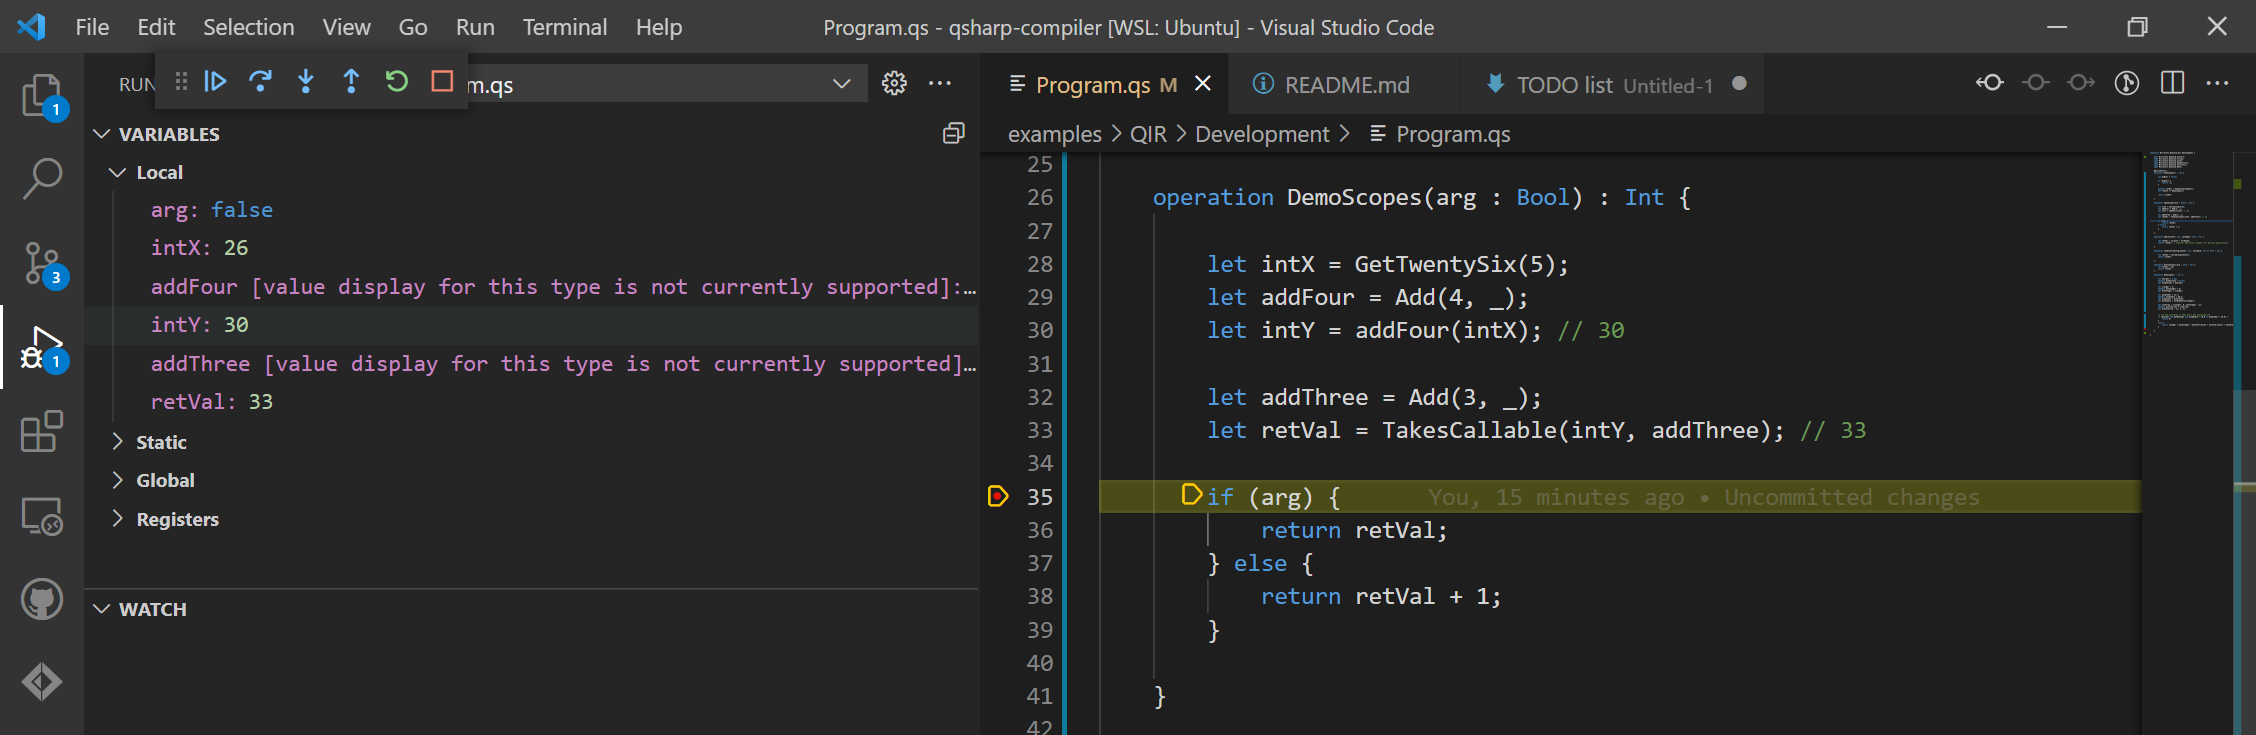
- When program execution is paused, the call stack correctly displays the trace of callables, and the user can switch between levels of the stack.
- At any level of the call stack, the user can view variables if and only if they are in the scope of the corresponding callable.
- The call stack displays correctly even when we pause execution inside a call to a partial application (a callable which has a subset of its inputs always set to the same values). This is important because partial applications are common in quantum programming.
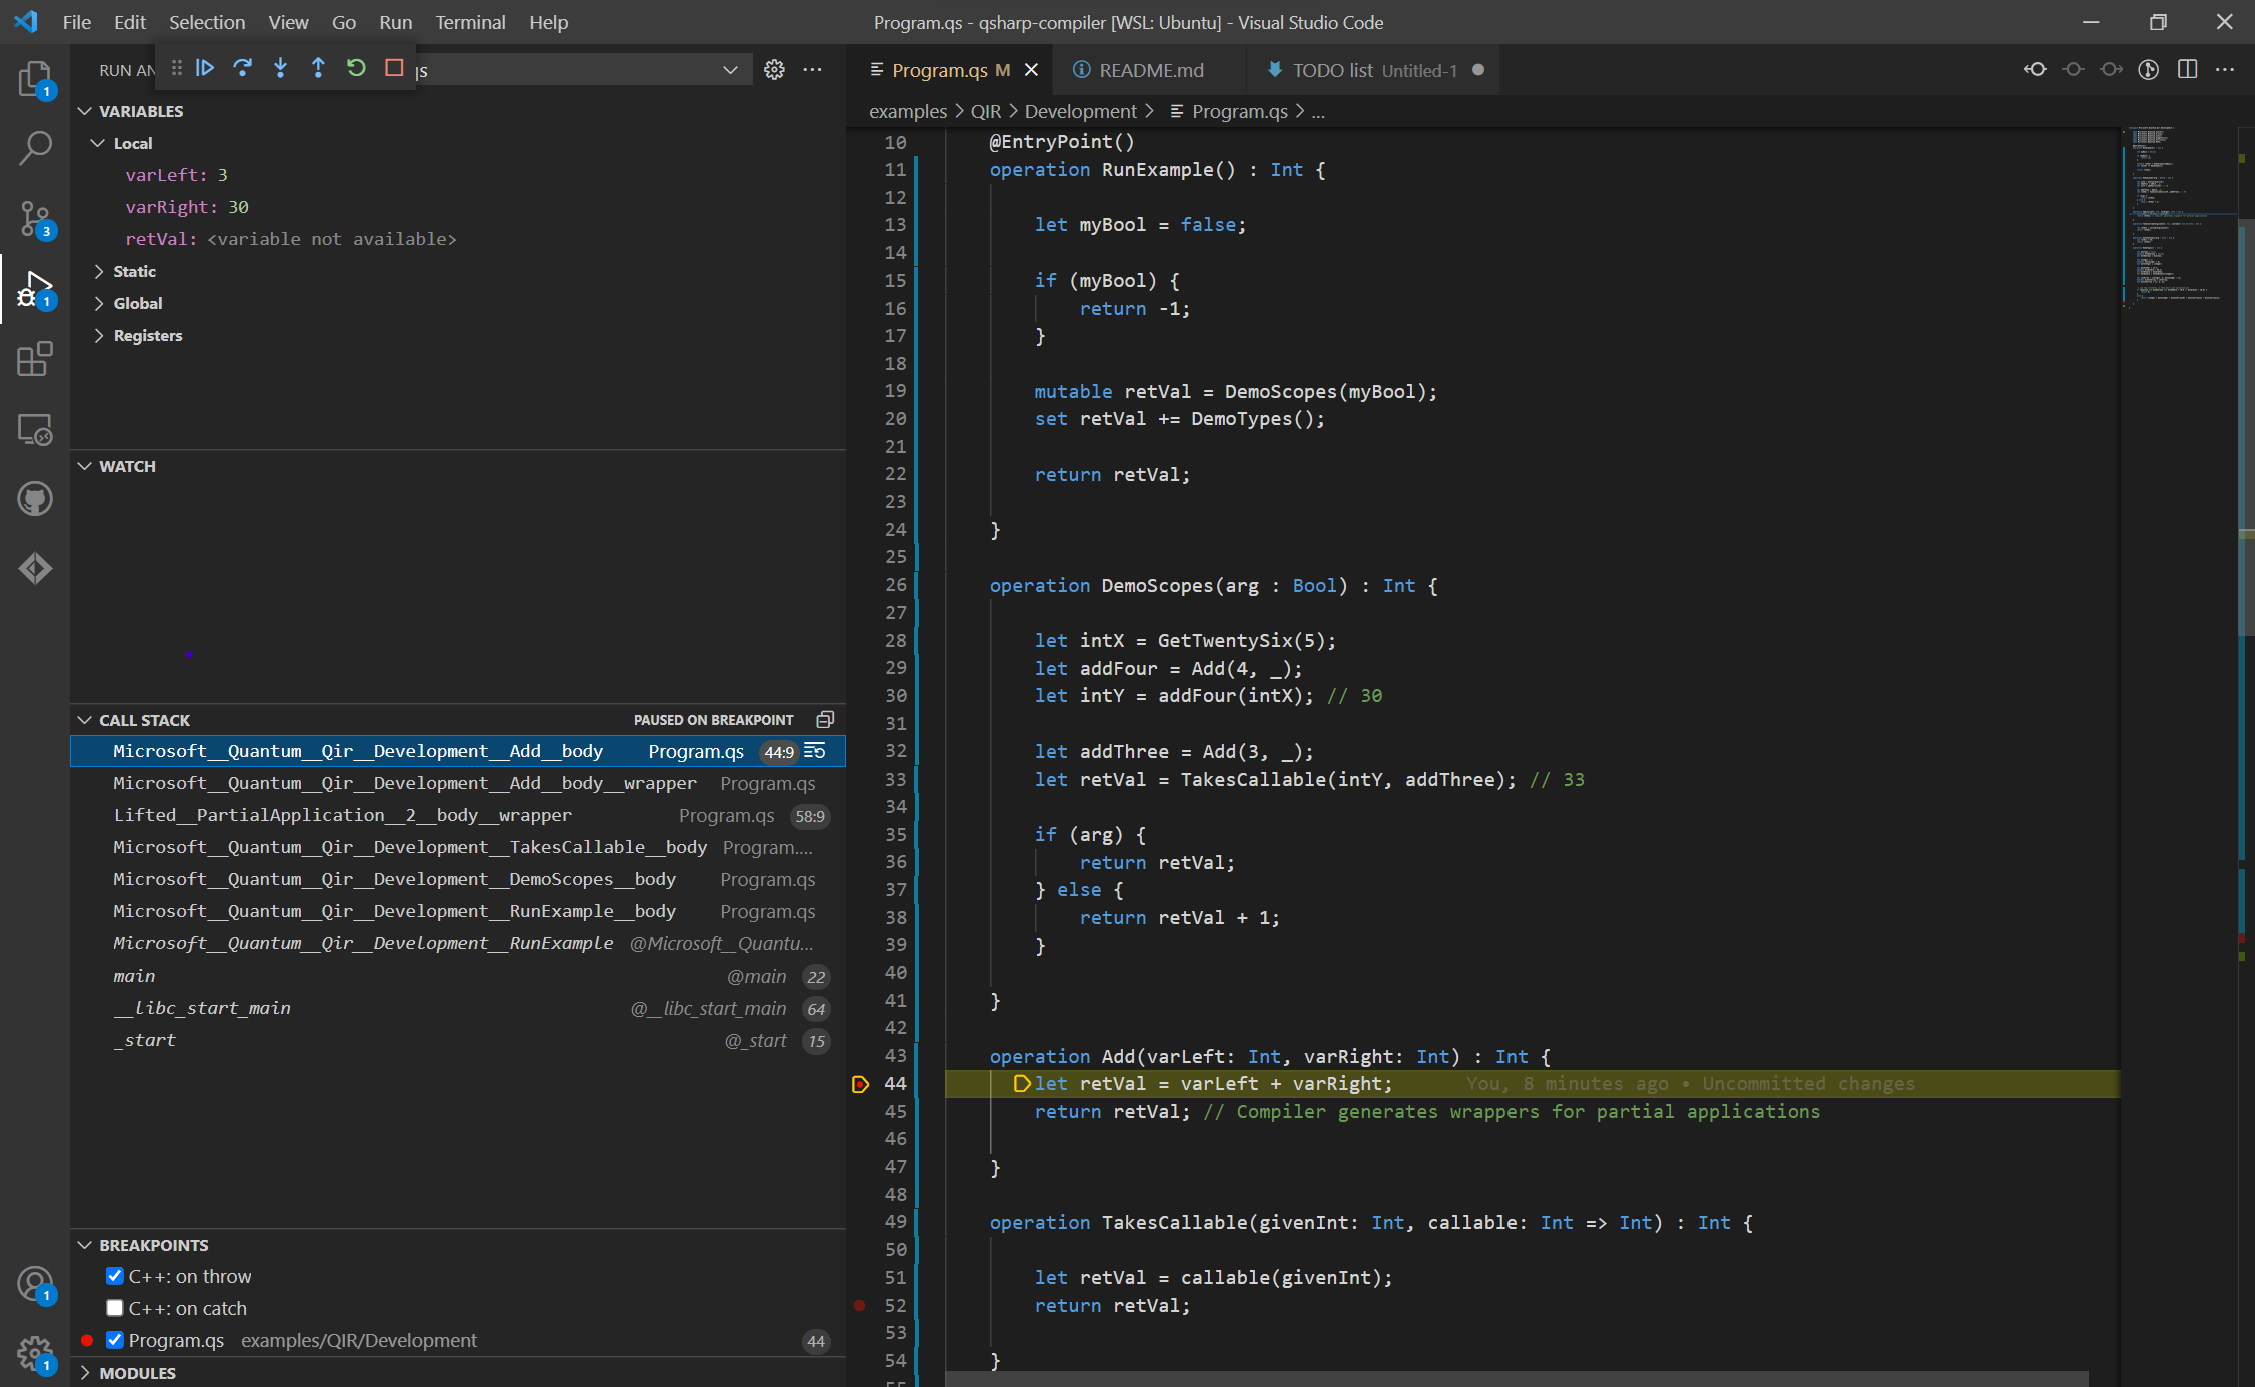
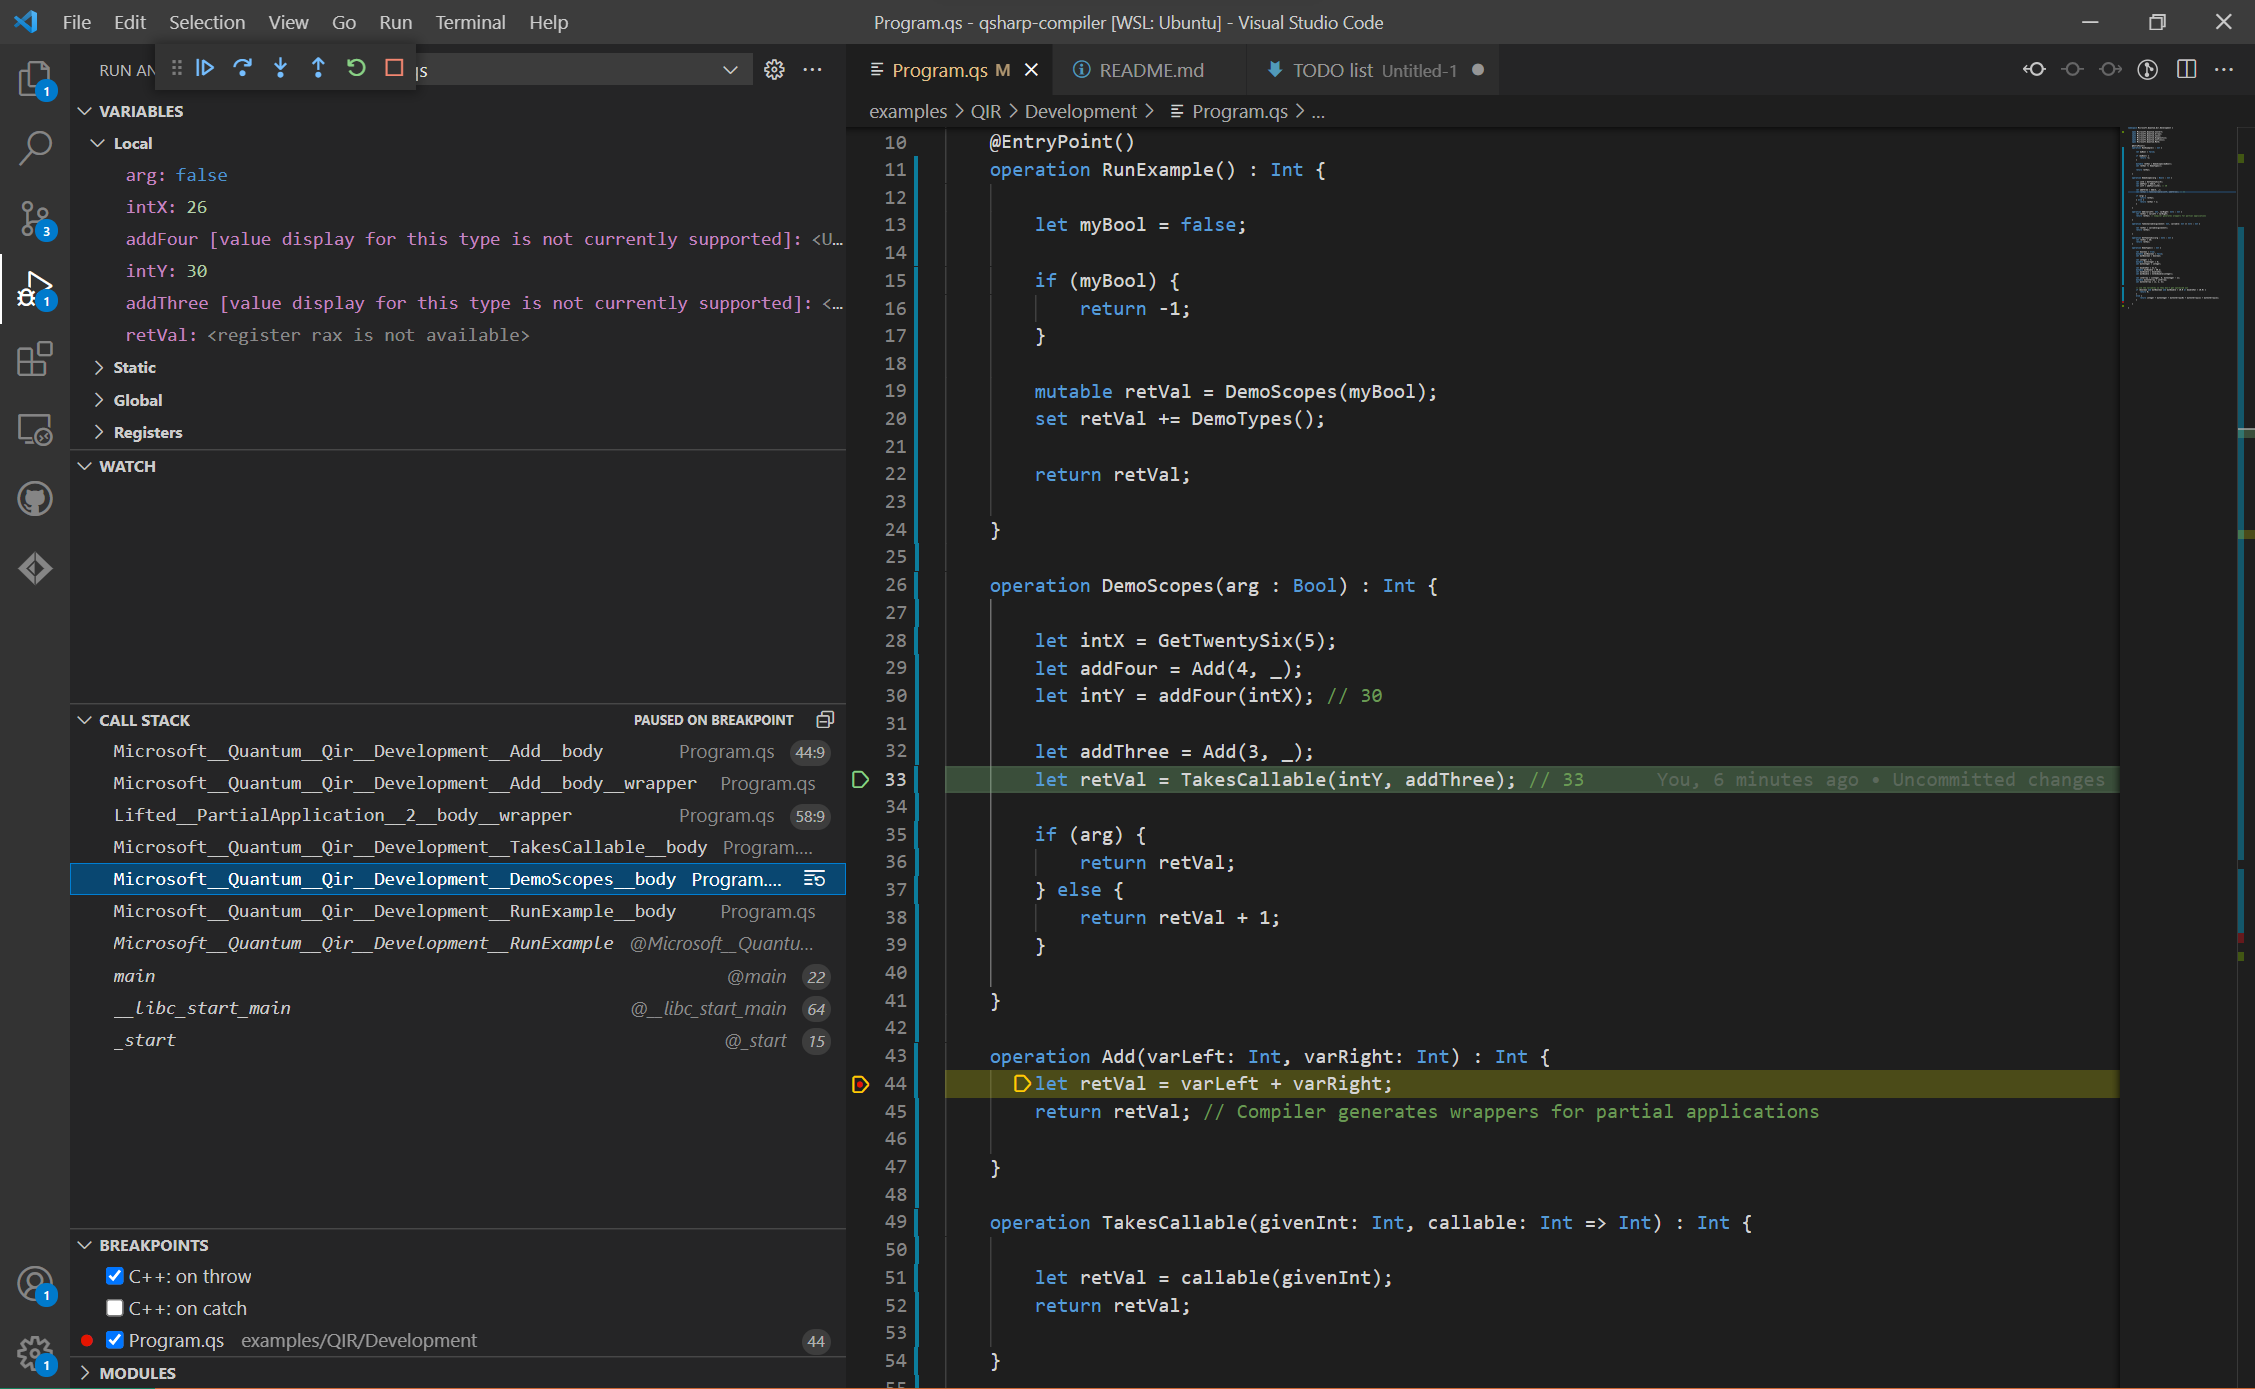
- The user can view the names of all quantum and non-quantum variables in the current callable scope.
- The user can view the values of simple non-quantum variables.
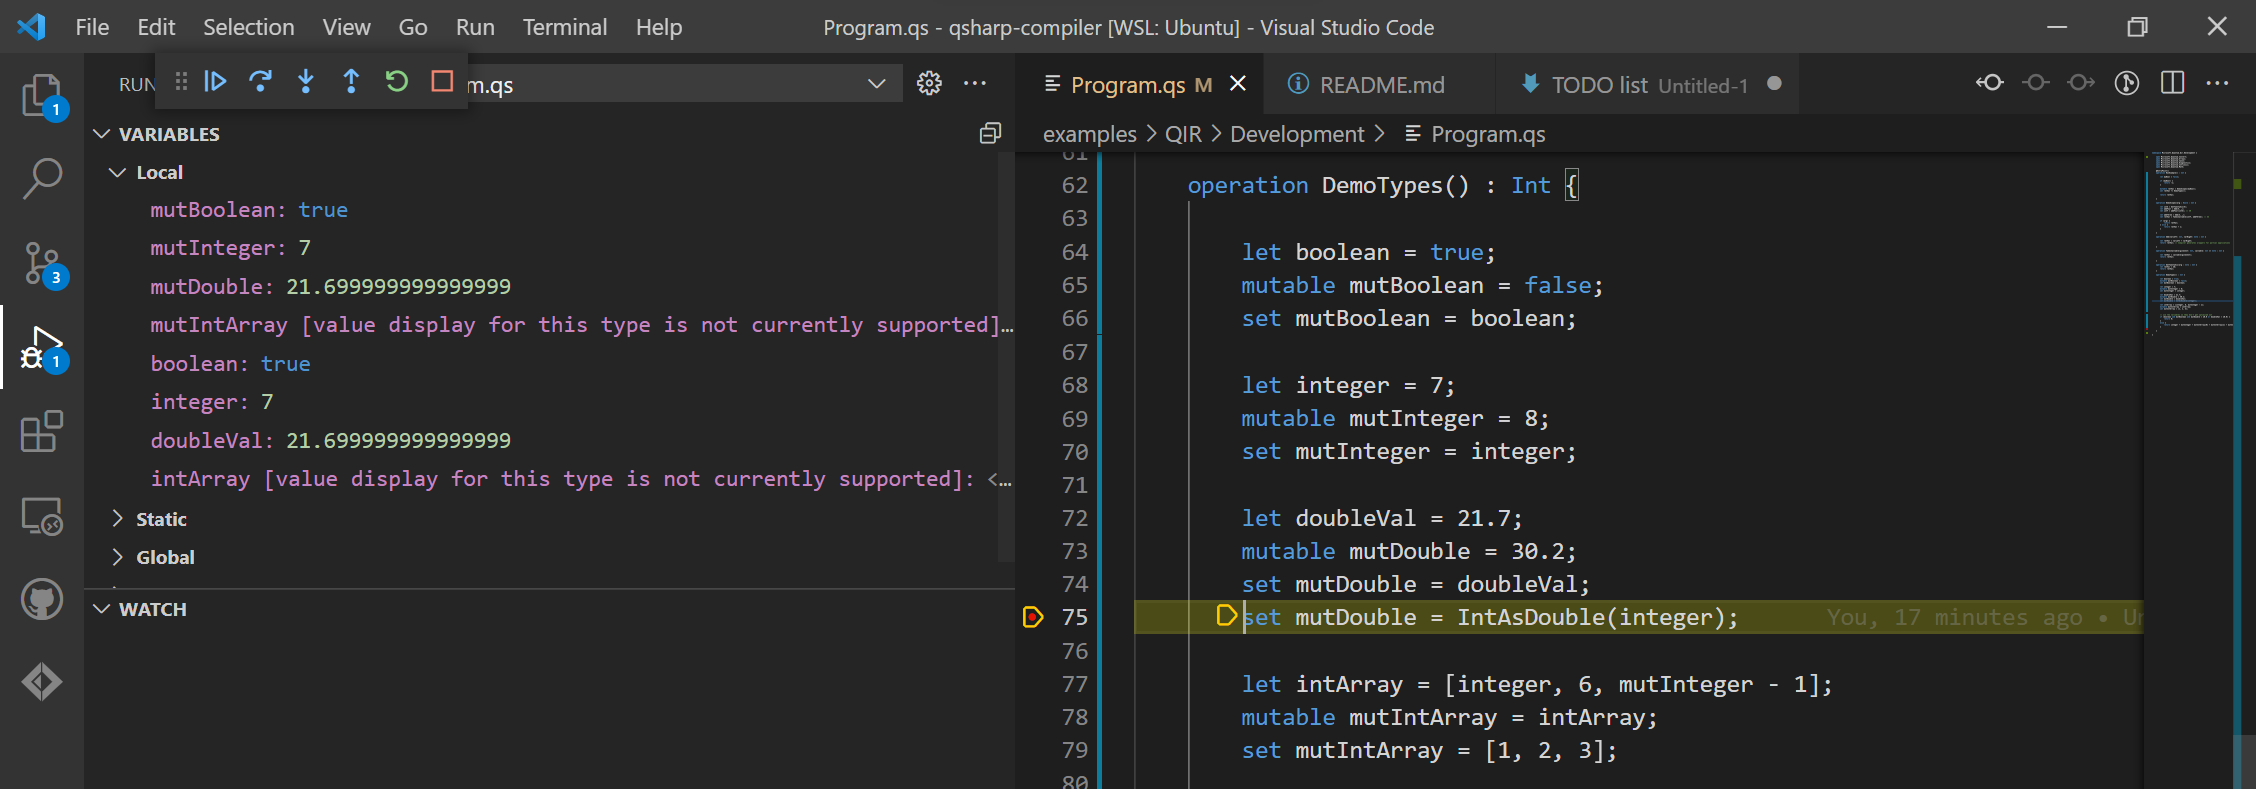
Although the variable information is limited to simple non-quantum types, the debug functionality from this feature is promising and surpasses the debug experience from the old Q# compiler in its correctness. Certainly, there is much more to implement before the Q# debugging experience is complete. In particular, I’m excited to see this feature expanded to support value access for variables of complex types such as arrays, tuples, and user-defined types.
I also look forward to seeing what runtime information can be provided for quantum variables. This is a particularly interesting aspect of the project because the debugger can’t measure the qubits during execution in the same way that it can read the values of non-quantum variables, since reading qubits affects their state. Instead, the compiler will need to track the state of the qubits throughout execution and provide this information to the user rather than a measurement. Of course, tracking qubit states classically is inefficient to the point of being impossible for real-world use cases. There will have to be important design decisions about what information to display to the user for quantum variables in order to maximize utility while maintaining a feasible amount of resource usage.
Conclusion
Emitting debug information within QIR was the focus of my internship the past three months. At risk of sounding cliché, this has been a fascinating project to work on. I’ve particularly enjoyed the aspects of research and architectural design that come with developing a new feature, two components of software development which haven’t been as prominent in my previous projects.
You can expect to see the feature as it stands in the upcoming January 2022 release of the Quantum Development Kit. I’m excited for the future of debugging in Q#, and I look forward to seeing the Q# projects this development tool helps you create!